NEWS RELEASE July 2018
Forecasts of Pump Purchases for each of the 6730 Largest Customers
There is a sea change in the way industrial pumps will be purchased in the future. Join us July 18 at 10:AM in a free webinar to discuss this sea change. Here is a summary of what we will discuss
Pump suppliers are now generating revenues of $56 billion. However, operators are spending $471 billion per year to own, operate and maintain those pumps. Furthermore the decisions regarding 84 percent of these expenditures are being made by 15,000 companies and less than 30,000 individuals, all of whom can be identified and pursued well in time to provide maximum influence on their choices.
There are 10,000 of the largest pump purchasers who will make 52 percent of the pump decisions. There are 5,000 consultants, plant and system suppliers who will make 32 percent of the decisions.
1. Forecasting the Purchases of Each Company
The first step in navigating the sea change in the market is to forecast the purchases which will be made by each of these 15,000 companies.
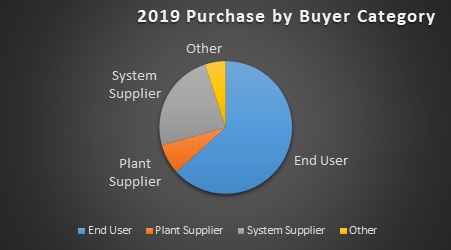
The majority of the purchase decisions will be made by end users. However plant, system and other suppliers will also be either direct purchasers or decision makers.
For a new plant (greenfield) the end user is likely to provide a bidder list but the plant, system supplier or engineering firm will probably make the specific pump choice.
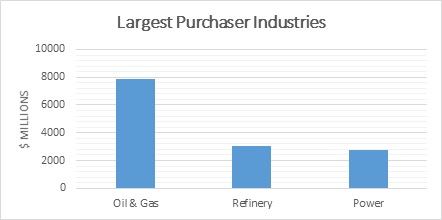
Most of the replace and upgrade decisions will be made by the end user. The following chart is from a pump supplier perspective. It segments the present purchases. It does not include the associated products sold by non-pump companies such as the VFD, motor or distributor packages.
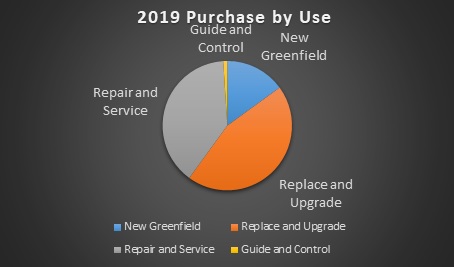
Presently most of the repair and service decisions are made by the end user. Guide and control revenues generated by pump companies are small. However, “IIoT and Remote O&M” is creating the sea change in the market and has the potential to greatly expand pump company revenue and impact market share.
10,000 end users will account for 52 percent of the purchases. 5,000 plant, system and other suppliers will account for 32 percent of the total. These targeted companies will spend $47 billion for pumps in 2019.
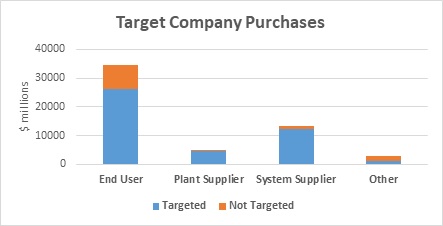
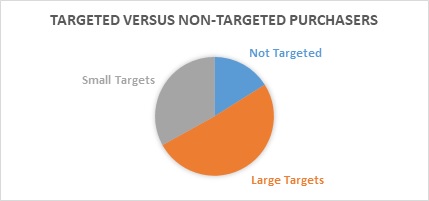
Targets are divided into large and small. 6730 large end users will spend $28.5 billion for pumps next year. This will account for more than 50 percent of total purchases. Smaller targets will spend 18.5 billion.
| Large Targeted Company Pump Purchases 2019 ($ millions) | ||
| Industry | # of Companies | Average per Company |
| Chemical | 1000 | 1.93 |
| Electronics | 80 | 1.41 |
| Flood Control | 100 | 1.18 |
| Food | 300 | 1.88 |
| Metals | 100 | 1.71 |
| Mining | 200 | 8.60 |
| Oil and Gas | 500 | 15.72 |
| Other Industries | 1000 | 1.49 |
| Pharmaceutical | 100 | 6.77 |
| Power | 200 | 13.96 |
| Pulp & Paper | 230 | 4.87 |
| Refinery | 320 | 9.41 |
| Stone | 600 | 3.42 |
| Wastewater | 1000 | 2.72 |
| Water | 1000 | 2.13 |
| Total | 6730 | 4.23 |
These 6730 companies can be considered the low hanging fruit. Each will average pump purchases of over $4 million. The purchasers in the oil and gas and power industries will spend the most whereas the flood control and electronics companies will spend the least.
A number of purchasers spend more than $300 million per year for pumps.
| 2019 Pump Purchases by Largest Customers | |||
| Company | Type | Corporate Location | Company Purchases $ millions |
| Sinopec | Operator | China | 607 |
| Saudi Aramco | Operator | Saudi Arabia | 597 |
| China Nat. Petr. | Operator | China | 571 |
| PetroChina | Operator | China | 491 |
| Guodian/Shenhua | Operator | China | 384 |
| ExxonMobil | Operator | U.S. | 359 |
| Royal Dutch Shell | Operator | Netherlands | 353 |
| Kuwait Petroleum | Operator | Kuwait | 336 |
Relatively few A/Es, plant suppliers and system suppliers will account for most of the $17.9 billion purchased by non-users. Large power plant system suppliers such as MHPS, Doosan, GE, Siemens and B&W are major purchasers even though some have a limited range of pumps. Some large oil and gas contractors have pump divisions but they are mostly in specialty areas such as oil extraction. Suez, BEWG and Veolia are examples of companies who both own water and wastewater plants, operate others and also design and offer systems using pumps.
Some companies are consultants, OEMs and operators. Jacobs CH2M designs and builds plants in various industries. It operates municipal wastewater plants in a number of countries. Bechtel, SNC Lavalin, and Sinopec are also active in all three categories. Sinopec spends $700 million/yr for pumps of which $600 million is for chemical and oil/gas operations and the balance is for design and supply for others.
These purchasers can be identified and pursued in a program offered by the McIlvaine Company and explained at www.mcilvainecompany.com
2. Making the Sale to Each of the 10,000
With increasing use of data analytics and continuous monitoring of pump performance purchasers will be making very informed decisions. Demonstration of lowest total cost of ownership will become the basis for making sales.
McIlvaine has extensive services on process systems using pumps. This includes sedimentation and centrifugation, macrofiltration, cross flow membranes, cooling, heat exchange systems and boiler feedwater systems. There are two services on scrubbers. One is for power plant FGD and another is for industrial scrubbers.
Pump purchases for scrubber systems are $800 million per year. This includes service and repair parts as well as replacement and greenfield pumps. It includes both the power plant FGD and the industrial scrubber applications. Two hundred scrubber companies account for 90 percent of the sales of pumps for new scrubber systems which amounts to $180 million.
In addition McIlvaine provides Decision Systems for coal fired boilers, gas turbines, municipal wastewater, ultrapure water and refining. With these resources pump suppliers can gain the knowledge they need to make validated lowest total cost of ownership (LTCOV) analyses.
3. Expanding the Revenue Base with Total Solutions
The pump manufacturers have the opportunity to work with end users as well as plant and system suppliers to provide edge computer packages built around continual innovations in pump design and applications.
The revenue potential is somewhere between the present $56 billion and the total present pump yearly costs of $471 billion. Pump companies can supply more of the auxiliaries such as variable speed drives which are now furnished by others. They can generate additional hardware and service revenues to reduce the $147 billion spent on pump maintenance.
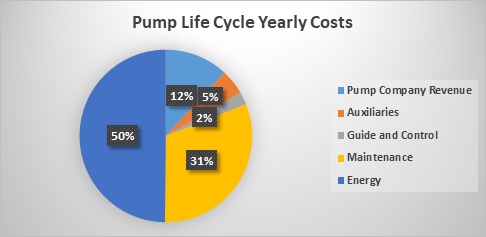
They can provide the guide and control packages to reduce the $235 billion spent on pump energy. Studies show that more than 30 percent energy savings is already economical. Energy costs in the U.S. are less than 50 percent of the costs in Europe and many Asian countries. So this savings is even more significant outside the U.S.
Pump companies with knowledge of the processes, the customers site specific factors and the edge software packages to integrate with end user cloud systems have the opportunity to expand revenues and more importantly raise EBITA at the same time.
You can register for the webinar July 18 at: Free Market Webinars
More information on the business program is found when you Click Here
Details on the pump market report with forecasts for the 200 top purchasers is provided at N019 Pumps World Market
Advice on the edge computer package and the future of pump automation is found at N031 Industrial IOT and Remote O&M