NEWS RELEASE December 2018
Manufactured Frac Sand Transforming the Combust, Flow, and Treat Markets for Granular Materials
Sand, gravel, crushed stone and sediment production and treatment generate billions of dollars of annual revenue for suppliers of combust, flow, and treat (CFT) worldwide. The market in the U.S. is changing considerably due to the rapid growth in manufactured shale frac sand. CFT expenditures for manufactured frac sand plants in the U.S. will exceed CFT expenditures for all the other granular related activities.
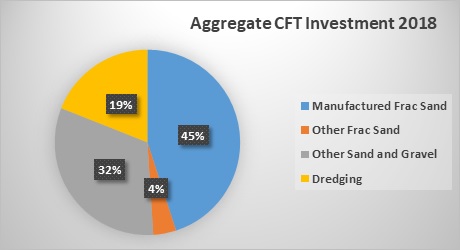
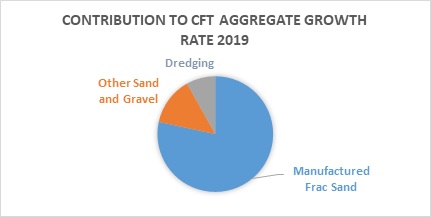
The importance of the manufactured frac sand on the U.S. CFT market is shown in the following chart. The tons of manufactured frac sand is small but the CFT expense per ton is high. Also the growth rate will be much higher than other granular categories. As a result most of the revenue growth in 2019 will be in manufactured sands.
| U.S. CFT Expenditures for Aggregate Production | ||||||
|
Granular Type |
2018 |
CFT Expense Ratio |
Factor |
% |
Growth Rate % |
Total Growth |
| Manufactured Frac Sand | 50 | 20 | 1000 | 45 | 13 | 5.8 |
| Other Frac Sand | 50 | 2 | 100 | 4 | -1 | 0 |
| Other Sand And Gravel | 700 | 1 | 700 | 32 | 3 | 1 |
| Dredging | 400 | 1 | 400 | 19 | 3 | 0.6 |
| Total | 1200 | 2200 | 100 | 7.4 | ||
The total production of frac sands in the U.S. will exceed 100 million tons this year at an average selling price of over $60 ton creating a $6 billion market. The revenues for CFT suppliers are much higher per ton of product because much of the production is shifting to local manufactured sands. So the big cost is in the processing and not the freight.
This fundamental shift in U.S. frac sand production is away from the Midwest, home to the highest quality Northern White, to lesser-grade sands which are then upgraded (manufactured). As a result, Northern White’s market share is expected to be 43 percent in 2019, down from 75 percent in 2014,
Various granular products require dry or wet processes. Some require both. These involve some combination of pneumatic or mechanical conveyors, pumps, valves, scrubbers, fabric filters, precipitators, filter presses, centrifuges, dryers, classifiers, fans, controls, and instrumentation.
In 2017, 890 million tons of construction sand and gravel valued at more than $7.7 billion was produced by an estimated 3,600 companies operating 9,400 pits and 360 sales/distribution yards in 50 States. Leading producing States were, in order of decreasing tonnage, California, Texas, Minnesota, Michigan, Arizona, Colorado, Washington, Ohio, Wisconsin, and New York, which together accounted for about 52% of total output. It is estimated that about 44% of construction sand and gravel was used as concrete aggregates; 25% for road base and coverings and road stabilization; 13% as asphaltic concrete aggregates and other bituminous mixtures; 12% as construction fill; 1% each for concrete products, such as blocks, bricks, and pipes; plaster and gunite sands; and snow and ice control; and the remaining 3% for filtration, golf courses, railroad ballast, roofing granules, and other miscellaneous uses.
Crushed stone, the other major construction aggregate, is often substituted for natural sand and gravel, especially in more densely populated areas of the Eastern United States. Crushed stone remains the dominant choice for construction aggregate use. Increasingly, recycled asphalt and Portland cement concretes are being substituted for virgin aggregate, although the percentage of total aggregate supplied by recycled materials remained very small in 2017.
Dredging may or may not involve more than just controls, pumps and valves. In many cases sediment is contaminated and must be cleaned with filters and separators. In the U.S. the amount of dredged material is around 200 million m3 or 400 million tons.
| Region | Percent of Global Dredging Revenue |
Revenue |
Amount Dredged (Million m3) |
| Europe | 0.12 | 1,284 | 265.29 |
| Middle East | 0.11 | 1,177 | 364.40 |
| China | 0.29 | 3,103 | 960.68 |
| India | 0.04 | 428 | 132.51 |
| Other Asia | 0.12 | 1,284 | 397.52 |
| Africa | 0.07 | 749 | 231.89 |
| North America | 0.09 | 963 | 198.97 |
| Latin America | 0.10 | 1,070 | 331.27 |
| Australia | 0.06 | 642 | 132.64 |
| TOTAL | 1.00 | 10,700 | 3,015.17 |
The McIlvaine Company provides specific forecasts for the CFT components in granular processing in the following publications
N007 Thermal Catalytic World Air Pollution Markets
N008 Scrubber/Adsorber/Biofilter World Markets
N018 Electrostatic Precipitator World Market
N021 World Fabric Filter and Element Market
N031 Industrial IOT and Remote O&M
N028 Industrial Valves: World Market
N024 Cartridge Filters: World Market
N006 Liquid Filtration and Media World Markets
N005 Sedimentation and Centrifugation World Markets
The forecasts for shale fracturing and specific projects are provided in
N049 Oil, Gas, Shale and Refining Markets and Projects
For more information contact Bob McIlvaine at This email address is being protected from spambots. You need JavaScript enabled to view it.