Telescopic View of the Air Pollution Control Galaxy
Air Pollution Control is a $100 billion galaxy in the $1 trillion AWE Universe. Will it grow to $170 billion per year in a decade or fall short? The answer is best determined by analyzing the synchronized motion of one hundred 1 billion-dollar/yr. stars, one thousand 100 million-dollar/yr. planets and 10,000 moons. All of which move in unison.
The moons combine various aggregations among one hundred countries, thirty product types, and thousands of operators in forty industries. OEMs can follow the lead of distributors and use the intelligence from the process equipment suppliers to plan the space travel.
Here is a telescopic view of the air pollution control industry to serve as a starting point.
It can be argued that the most active stars are those dealing with CO2 absorption followed by liquefaction and sequestration. The importance is magnified by the need to remove all the air pollutants from the CO2 prior to liquefaction.
30 years ago, CO2 suddenly became an air pollutant. It is now viewed in a manner similar to SO2 or NOx. SO2 is captured in absorbers. Most use a limestone slurry and produce gypsum. A minority makes sulfuric acid. Some sulfur becomes calcium sulfate waste and is stored in landfills.
Similar processes are now being employed to remove CO2 from stack gases. Absorbers concentrate the CO2 which is then liquefied and delivered back to the underground reservoirs from which it originated.
Major air pollution system companies such as MHI and B&W have applied their absorber knowledge to capture CO2.
The liquids and powders capital equipment for air pollution control is just as significant as the equipment to treat gases. Pollutants are transferred from the air to liquids which must then be purified. Powders are added to react with gases and are also part of the waste stream.
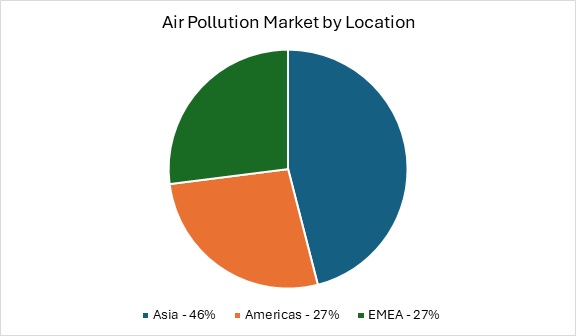
The 2034 air pollution market is subject to major variables and could range from $130 billion to $170 billion by 2034.
The power sector is the largest market followed by oil and gas.
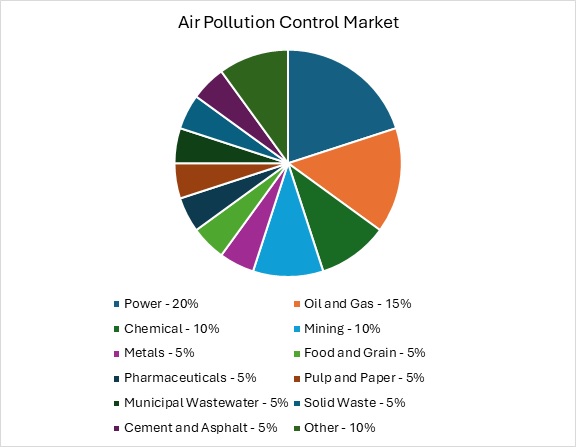
Many light industries from textiles to printing are included in the other category.
Market by Pollutant Type
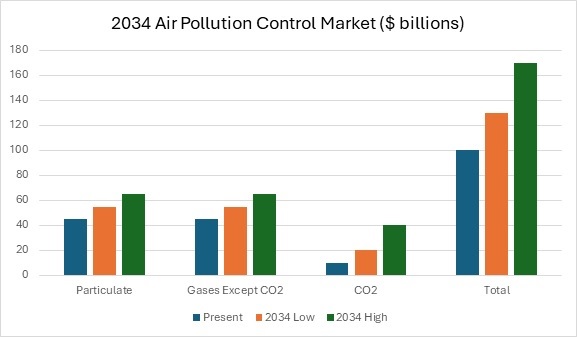
If the current forecasts for CO2 capture are met the market will show healthy growth.
Air pollution control and CO2 capture are intertwined A big air pollution control investment is needed to clean the CO2 prior to liquefaction.
Suppliers of products to treat gases, liquids and powders can be guided by the interdependency of products.
- The end user and his A/E set the production goals and design accordingly.
- System suppliers receive the first orders to provide solutions to meet production and environmental goals.
- The second set of orders goes to process equipment suppliers.
- Based on process needs the pumps, valves, compressors, and fans are then ordered.
- Lastly, orders for consumables are placed.
There is a synchronization of all these moons. A supplier needs to be informed about all of them. A new CO2 absorber can cost effectively capture 99% of the CO2. This changes the Market by substantially for many components.
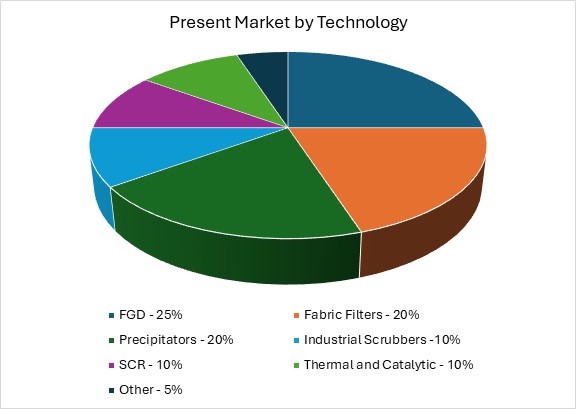
Technology
Flue gas desulfurization (FGD) is the most utilized technology. The fabric filter technology is taking away market share from precipitators. Selective catalytic reduction is now applied in most power plants and large combustion sources.
Industrial scrubbers include chemical absorbers.
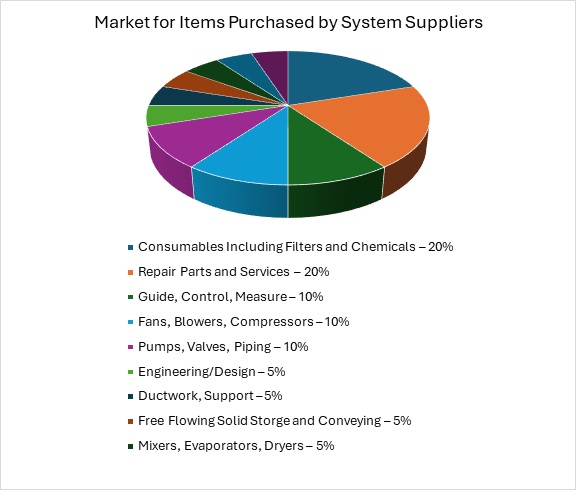
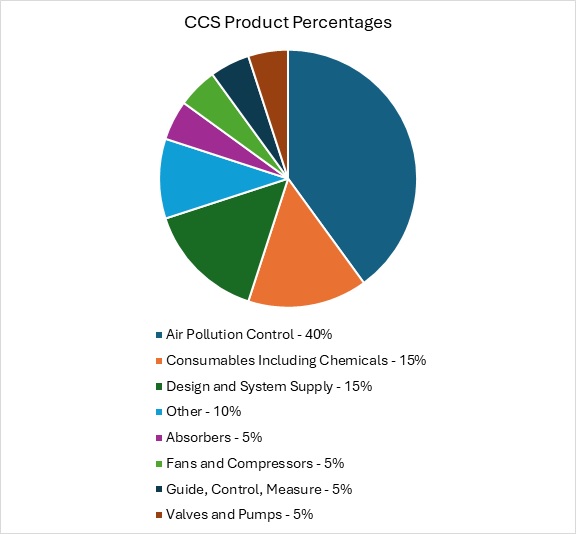
Purchased Items
Many scrubber and precipitator suppliers purchase most of the components in their systems.
The air pollution control product mix includes lots of fans, blowers, and compressors. Many of the vessels are too large to be shipped as complete units. Therefore, on-site construction is needed. Ductwork accounts for up to 5% of the total.
Location
Asia is both the largest and fastest growing market.
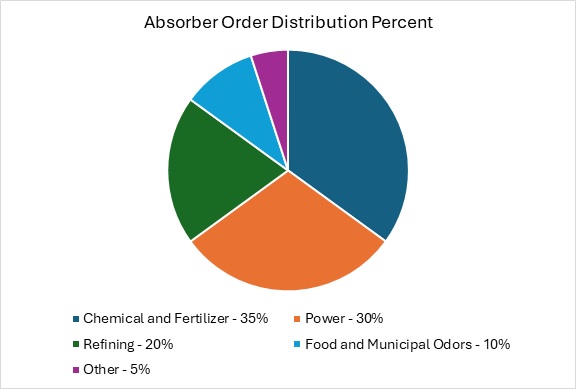
Absorbers
Power presently accounts for 30% of the absorber purchases. But this could rise to 70% if CO2 capture plans materialize.
Vessels with spray nozzles and mist eliminators are used for a wide range of pollutants from SO2 to odors. Sizes can range from less than one foot in diameter for lift station odors to more than one hundred feet in diameter for a large limestone absorber in a power plant.
Multiple absorbers are often employed. For CO2 recovery, the initial absorber removes acid gases and then the downstream absorber captures the CO2. Where particulate fouling is not a concern the absorber is equipped with mass transfer elements such as packing.
Slurry absorbers are used in coal fired power, mining, waste incineration, pulp and paper, sewage sludge incineration, refining, and various chemical processes.
The pumps and valves are frequently lined to provide corrosion and abrasion resistance.
Absorbers used for mass transfer in chemical processes are a unique application where transfer efficiency is paramount.
Odor control scrubbers are needed in sewage and food applications.
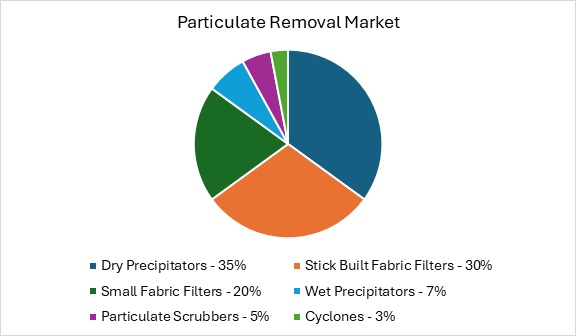
Particulate
In the 1970s most hot gas particulate was removed by precipitators or scrubbers. Over the years that has changed. Stick built fabric filters with as many as 10,000 bags are common. The scrubber share has plummeted in direct proportion to the increase in required efficiency.
Particulate scrubbers:
Fans developing pressure drop as high as 30 inches (e.g. Create sufficient turbulence in a scrubber to remove small particles). Venturi scrubbers are used in conjunction with kilns and furnaces.
Fabric Filters
Glass or polymeric media is used to filter particles in applications ranging from cement kilns to power plant exhaust. There are two sets of suppliers. One set such as Donaldson and Nederman make small units which can be shipped already assembled. Anoth4er set of suppliers makes the large4 units which are assembled on site and classified as stick built.
Andritz and Longking are large unit suppliers.
Bags are replaced every year or two and generate $ billions of revenues. Parker Hannifin and BWF Envirotec are major bag suppliers.
Dry Electrostatic Precipitator
Most coal fired power plants around the world utilize dry electrostatic precipitators for fly ash capture. China operates nearly half of these precipitators and continues to add more capacity. Growth in Asia more than offsets closures in Europe and the U.S.
Longking is one of several major suppliers based in China. B&W is one of the remaining U.S. suppliers. Andritz is active in Europe.
Wet Precipitators
When sticky dusts are encountered, wet precipitators are often applied. Oriented strand board manufacturing is an example. They also are used for acid mist. In the U.S. and China there are systems where stage 1 is a dry precipitator, state 2 is a scrubber, and stage 3 is a wet precipitator.
SCR
NOx emitted by power plants, refineries, and various combustors is reduced with selective catalytic reduction. Plate or honeycomb catalyst is located in the hot gas stream and preceded by ammonia injection.
The refinery industry uses ozone injection ahead of the scrubber to convert the NOx to soluble NO2.
Catalysts typically must be replaced or chemically rejuvenated every two years. Precipitator and FGD suppliers are most frequently the SCR suppliers.
Thermal and Catalytic Oxidation
There are a number of applications where VOCs or other noxious gases can be oxidized through combustion or use of catalysts. Regenerative thermal oxidation entails heat recovery and reuse. This requires additional investments in vessels and dampers. Applications range from automobile painting to plastics manufacture.
Durr based in Germany is a leading supplier. Johnson Matthey is a major catalyst producer.
Air Pollution Continuous Monitoring
Environmental agencies in the U.S. Europe, China, Japan and many other countries require continuous reporting of priority pollutants from each major plant. Companies such as Thermo Fisher supply a wide range of instruments to measure particulate and gases.
Due to this extensive monitoring, it is possible to expand to remote O*M services. One successful example has been dry scrubber operation in some Eastern U.S. power plants.
Carbon Capture and Sequestration
This market could range from $10 billion/yr. to $40 billion/yr. in 2034. CCS figures in two of the three CO2 mitigation approaches.
- Carbon avoidance
- Carbon neutrality
- Carbon removable
Carbon avoidance involves technologies such as wind and solar. The economics of wind vary with space cost, wind conditions, and distance to market. The same is true for solar.
Carbon neutral technologies such as CCS are a good choice when wind and solar are relatively expensive.
Green hydrogen cost varies with renewable electric cost and distance to market. Transporting hydrogen is verry expensive. Blue hydrogen with CCS is gaining traction.
Carbon negative technologies using biomass (BECCS) are likely to be a big winner.
Many countries have joined the United Nations coalition to achieve Net zero by 2050. The goal is to emit no more CO2 than will be absorbed by vegetation and seas. The challenge is that many sources of CO2 are almost impossible to eliminate. Therefore, there is growing support to capture and sequester CO2. If the source is biomass, then the technology becomes carbon negative.
In the UK the 4000 MW Drax power plant now burns wood pellets. CO2 capture systems have been installed and a pipeline to the North Sea is being completed.
There has recently been a major development. MHI and others have developed carbon absorption systems which can cost effectively capture 99% of the CO2 up from 90% previously.
Around 40 CO2 capture commercial facilities are in operation. Since January 2022, project developers have announced ambitions for around 50 new capture facilities to be operating by 2030, capturing around 125 Mt CO2 per year.
CCS requires much cleaner gas than is allowed in stack discharges. So, 40 percent of the CCS investment will be in additional air pollution control equipment.
Longer term CCS could greatly boost the air pollution market. Every coal fired plant which switches to wood pellets and CCS will take as much CO2 out of the air as once was emitted. The more dire the climate change forecasts the greater the potential for CCS.
Moving Forward
For decades McIlvaine has produced market reports on each major air pollution control technology. Each has tens of thousands of forecasts (1). But the reports are just the starting point. If you sell severe service valves your priorities may be scrubbers for FGD, fertilizer, and catalytic crackers. You need a detailed focus on these applications.
We provide the equivalent of the James Web Space Telescope to give you the initial data to start planning your space travel.
Leveraging the Entire Universe of Process Equipment in Your Market Strategy
The challenge is to put the equivalent of the space telescope on your CRM system with specific travel coordinates to help individual s\salesmen. There are 7 steps in the program.
- The telescopic overview
- Ranking of moons based on ROI and ease of pursuit.
- First trip planning
- Report delivery and approval by management.
- Integration of needed data in CRM
- Success Evaluation
- Using increased revenues to sequentially fund the balance of the program.
More information on the program is available from Stacy Hall This email address is being protected from spambots. You need JavaScript enabled to view it.
Bob Mcilvaine can answer questions and can be reached at 847-226-2391 This email address is being protected from spambots. You need JavaScript enabled to view it.
(1) Multi Client Air Pollution Control Reports
N007 Thermal Catalytic World Air Pollution Markets
N008 Scrubber/Adsorber/Biofilter World Markets
N018 Electrostatic Precipitator World Market
N021 World Fabric Filter and Element Market
N027 FGD Market and Strategies
N056 Mercury Air Reduction Market
N031 Industrial IOT and Remote O&M
(including instrumentation and automation)
![]()
AWE Alert
January 2024
The Future of the AWE Industry Depends on New Variables
Since the end of World War II, government policies have not been a variable in determining the future AWE market. Not too many years ago the major nations including China agreed on a policy to a policy which would result in stopping CO2 increases by 2050.
China has been a leader in applying air pollution control equipment to coal fired boilers. India is installing scrubbers and more efficient particulate control equipment. Hungary and Turkey have made significant pollution control investments.
The situation has radically changed in the last two years. Europe has put retired coal plants back into operation. Fighting has taken place at nuclear power plants in Ukraine. China has moved away from free enterprise. U.S. policy in the future depends on politics. The EU realizes the risks of depending on a consistent U.S. policy.
The U.S. is the world leader under almost any metric that is used. GDP has grown at a rate greater than other countries in the last few years. China is no longer seen as overtaking the U.S as growth rates have halved.
The U.S. produces more oil and gas than any other nation. It has the best military of any country. Its nuclear arsenal is equal to any other. It has been a strong partner in NATO. Its commitment has made European and some Asian countries confident enough that they have not built up their own nuclear arsenals or otherwise entered an arms race.
Given developments in Ukraine, North Korea, China, Hungary, Russia and the United States political stability is no longer assured. As a result, AWE companies have to consider all the potential factors including an isolationist U.S.
Republicans appear to be supporting a 10% tariff on all imported goods and not just China. This America First policy could have a positive effect on domestic AWE service and fabricating companies. Specialized pump, valve, and compressor component manufacturers could see an increase in business. Many distributors offer to manufacture custom parts.
U.S. manufacturers of air and water filters will be in a better position in the domestic market. U.S. systems companies will also benefit.
The downside for the U.S. AWE industry is the fact that 80% of the market is based on an international system which has castings manufactured in India and China at a fraction of the cost of a U.S. option. So, one way or another costs for U.S. goods will rise.
The majority of the revenue in the AWE industry comes from international companies such as Emerson, GE, Dupont, 3M, Donaldson, and Ingersoll Rand. Barriers to free trade will be detrimental to these companies. But they have flexibility which domestic companies do not have. They can invest more in their offshore operations and then pursue geographies where they see the greatest potential.
The AWE industry will also be greatly impacted by the changes in global warming policy should isolationist regimes dominate in China, the U.S. Turkey, Hungary, and other countries.
McIlvaine has been striving to predict political trends and their impact on the AWE market for 4 decades. It is complicated when you try to predict who will drink the Kool-Aid at Jonesboro or be swayed by the $77,000 payment to families of dead Russian soldiers.
The challenge is to predict life quality preferences for individuals rather than assumptions in the conventional sustainability models. The patriarch setting up a trust fund for grandchildren has far different motivations than the father of a starving family in Gaza. This recognition of individual human motivation is the cornerstone of the Universal Sustainability Rating System (SURS) https://www.mcilvainecompany.com/SURS/subscriber/Default.htm
Using SURS to Predict the AWE Market Future
The AWE market will be shaped more by politics in the next decade than at any time since World War 2. Political decisions are a result of individual choices, either voluntary or forced.
The basic element is life quality preferences. The average person would rather enjoy life and live to 80 rather than be a recluse and live to 100. The race car driver and the soldier who falls on the grenade are extreme examples.
The Sustainability Universal Rating system has all sorts of uses in helping predict the AWE market. It was first used in contracts with Thermo Fisher and Rockwell. One wanted a common metric to measure CO, CO2 and Nox. The other wanted a common metric to measure each of the toxic metals.
The metric takes into account personal life quality benefits. NOx causes regional haze. But the importance to some people is greater than to others. EPA treats mercury among the top dangers. But the concern is about pregnant women who eat Tuna. Are the life quality benefits so high for tuna consumption by pregnant women that it should be ranked higher than lead which people can’t avoid if it is in the air or water.
The common metric called Quality Enhanced Life Days (QELD) aggregates the perceived life quality choices of those affected.
The reality is that life quality choices are both personal and as a member of a tribe. The tribe can be the family, city, country, or cult. Death, comfort, Joy, and pain are viewed differently by individuals and tribes.
Poor rural Russians are a tribe which is mollified by death payments of $77,000 for a son killed in Ukraine. For those who believe Russian mothers will dissuade Putin, this is a sobering fact.
EPA uses $ 7 million for each iife in its cost evaluations. Given the trading value of CO2, one life is worth 700 million lbs. of CO2.
Automobile travel is one of the most dangerous endeavors. Statistically every 1000 miles as a traveler reduces life by several hours. Someone willing to drive 1000 miles for a basketball game is creating a QELD of a few hours for one basketball game. If someone is willing to drive 1000 miles to Virginia and wave a NAZI flag. He is creating a QELD quotient of several hours. If he is willing to storm the capital despite a 15 sentence in prison, he is creating many QELDs. The soldier that falls on the grenade is creating tens of thousands of QELD equal to his otherwise remaining life.
This analysis was lacking by Russia and ROW when Ukraine was invaded. There were many more willing to fall on the grenade than were anticipated.
People have unique life quality preferences. If a large enough group wants to be part of the MAGA tribe, then the voting in November then the voting in November will reflect it.
SUSTAINABILITY IS A BALANCE
Net Zero is an aspiration which was accepted by the Nations of the World because it was voluntary.
This policy is a top-down aspiration and may not reflect the life quality choices of the majority of the world’s citizens.
Definition of Sustainability: Sustainability is a balance between the life quality goals of the tribe and the life quality goals of the world. There is also a future value discount. How important is what happens 50 years from now to a starving family in Gaza.
The U.S. spends less than 0.2% of the budget on humanitarian aid. So, the importance of the tribe is greater than 99 to 1. So, sustainability in terms of water needs to be individualized. If you live in a drought area and have a brown lawn the value of CO2 per ton of water will be different from someone in a water surplus area.
The whole purpose of the SURS is to determine what each tribe wants rather than what is best for the world. The AWE predictions are based on the extent to which various tribal wishes will be fulfilled. The new reality is that this fulfillment will be shaped in a large part by political events of which war is just one.
Will Net Zero be instead Net Survival
The AWE industry has been shaped in the last 100 plus years with little political interference. Unfortunately, AWE managers now have to take seriously a market where isolation and aggression are potential negative forces.
At the very least the more expensive net zero initiatives will be delayed. Green hydrogen will not receive the investments which blue hydrogen and BECCS will receive. Coal will continue to expand in Asia. Where wind and solar are not clearly less expensive due to space and climate the progress will be slowed.
Exxon Mobil publishes a detailed forecast which shows the 2050 need to serve 2 billion more people with twice the purchasing power as today. This forecast is not based on Russia occupying large parts of Europe, China invading Taiwan while the U.S. abdicates world leadership.
Up until 2 years ago the threat that aggression would be the dominant force was less than 5%. Developments in The U.S. China, and Russia in the last 2 years have increased the odds. The big variable is the U.S. As long as the U.S. maintains its policies to protect the free world, the risks of aggression and chaos are low.
McIlvaine forecasts will now provide alternatives where autocratic decisions shape the world and with it the AWE industry.
Without Excessive Political Interference the forecast is bullish. ExxonMobil projects a world in 2050 where politics plays the role it does today.
The global population is projected to rise by 2 billion people, a 25% increase. It took thousands of years for the world to reach the first 2 billion people, which happened around 1930² – the next 2 billion is predicted to take around 30 years. Not only will there be more people, but they will have greater opportunity and prosperity. Global GDP per capita – measured as purchasing power per person – is expected to rise by roughly 85% by 2050. Those who live in developed countries are projected to see purchasing power rise roughly 50% to around $70,000. Most of the world's people live in developing countries (non-OECD) and are projected to see purchasing power more than double to $25,000. While this growth projection is impressive, people in the developing world would still have far less purchasing power in 2050 than people in developed nations have today.
Energy use and improved living standards go hand in hand. You can’t have one without the other. When China’s per capita GDP was around $2,000, its energy use was low – about 36 million British thermal units (MMBtu) per person per year, deep in the realm of energy poverty. By 2021, when per capita GDP passed $11,000, China’s energy use had risen to 101 MMBtu per person, well above the global average. In contrast with China, Africa’s energy use per person has remained at a low 27 MMBtu for the past two decades, and its per capita GDP has only risen by about $500 during that time. Areas that remain mired in energy poverty struggle to raise the living standards of their people. As we look ahead to 2050, how much more energy must the world produce to meet the needs of 2 billion additional people and a global economy that has doubled in size? About 15% more, according to our projection – with nearly all of it going toward meeting the higher living standards of a developing world with a larger population.
The Global Outlook projects that the biggest change in the world’s energy mix between now and 2050 will be a significant increase in solar and wind, along with a significant reduction in coal. Energy from solar and wind is projected to more than quintuple, from 2% of the world’s supply to 11%. Coal will increasingly be displaced by lower-emission sources of electricity production – not just renewables but also natural gas, which has about half the carbon intensity of coal. Overall, electricity use grows 80% by 2050. Oil and natural gas are projected to still make up more than half of the world’s energy supply. The utility of oil and natural gas in meeting the world’s needs remains unmatched. They are energy dense, portable, available, and affordable — and serve as essential raw materials for many products we use today. Given that oil and natural gas are projected to remain a critical component of a global energy system through 2050, sustained investments are essential to offset depletion as production naturally declines by 5-7% per year. Oil use is expected to decline significantly in personal transportation but will remain essential for the industrial processes and heavy-duty transport like shipping, long-haul trucking, and aviation that underpin economic growth. Consider: If every new passenger car sold in the world in 2035 were an electric vehicle, oil demand in 2050 would still be 85 million barrels per day, the same as it was around 2010. Natural gas use is projected to increase by more than 20% by 2050 given its utility as a reliable and lower-emissions source of fuel for electricity generation, hydrogen production, and heating for both industrial processes.
Political Dynamics will Dominate the AWE Industry in 2024
Lurgi was a leading AWE company who due to the Nazi political usurpation found itself designing the coal liquefaction systems needed to fuel the Luftwaffe and the Panzer divisions, At the same time they were trying to protect their Jewish chief engineer.
In 1940 the political developments changed the course of history and by 1945 50% of the world AWE market was in the U.S. IN the next 77 years Politics had the potential to create havoc for the industry but the risk was low.
The relative stability was in part due the U.N. and NATO but most importantly the U.S. commitment to stop aggression backed up by the greatest military force in history.
Candidate Trump is proposing a flat 10% tax on all imports. He imposed an 18% tax on Chinese imports in his first administration. but there’s no tax on the countries with whom the U.S. works closely. Trump plans negotiated adjustments for some countries. This initiative is seen by the Trump team as a way to keep “America First.”
Political Impacts on the World Energy Industry
Trump discounts global warming impacts of energy production. He advocates relatively unrestricted use of fossil fuels. He says electric cars lack the range and are too expensive. He promises great gains in oil production in the U.S. But the US is producing enough oil and gas now to dominate world production. In Europe some coal plants were not retired and the priorities of substituting local for Russian energy are substantial.
The sanctions on Russian pipeline deliveries have resulted in new customers rather than reductions.
Russian production has remained constant over the last year. There are few signs of resistance to the Ukrainian war within Russia. The hundreds of thousands of Russian soldiers who have died were mostly from poor areas. The survivors received $77,000 which is the equivalent of a fortune due to low wages.
Net Zero and Sustainability
So, what is the future of net zero, electric cars, hydrogen and other GHG driven initiatives.
The net zero policy is to balance emissions by 2050. At this point in time man-made emissions will be reduced to where they are offset by the net absorption of CO2 by forests and seas.
This sustainability target is a compromise.
Sustainability is a balance between the benefits for a smaller group now and a larger group in the future. In Ukraine the balance shifted with the invasion to where the benefits long term are devalued. In Gaza the benefits are immediate survival.
So, sustainability is a balance which changes with war. It is also a balance which is much different for isolationists or Invaders than for globalists.
Coal Continues to Hold its Own
Coal power continues to expand in China, despite the government’s pledges and goals. In the first half of 2023, construction was started on 37 gigawatts (GW) of new coal power capacity, 52 GW was permitted, while 41 GW of new projects were announced, and 8 GW of previously shelved projects were revived. Of the permitted projects, 10 GW of capacity has already moved to construction.
Permitting continued apace in the second quarter and in some provinces, newly permitted power plants are moving rapidly into construction, while in others, developers might be securing permits “just in case” and not hurrying to break ground. Of plants permitted in 2022, about half (52 GW) had started construction by summer 2023.
In 2000 China was on a course to be a world leader in environmental control. Longking and a number of other companies were producing some of the world’s most efficient air pollution systems. Chinese companies sold their systems throughout Southern Asia.
There was offshore investment in companies who operated with little government supervision.
That all started to change when the free-market policy was reversed and state enterprises started to take control. The change in attitude coincided with the slump in economic growth. No longer is China the symbol of economic prosperity.
Semiconductor Industry Anticipates Double Digit Growth Unless China Interferes
The world semiconductor industry growth should be robust absent any interference in Taiwan by China. The Taiwan dominance of the advanced chip market is protected as much by intellect as hardware.
In Mid-January 2024 Taiwan reelected the pro-western party. China had spent considerable effort on the two opposing parties. The ruling party only received 40% of the vote. But this was enough to win. In the wake of the election tensions are rising. An invasion of Taiwan would not only destroy the delicate semiconductor operations but also the ability to re-create them. In fact, the dominance has been in the ability to develop the next generation of chips before competitors can.
The semiconductor market faced a slowdown in 2023, with a projected 9% decline compared with 2022. The memory market is particularly hard-hit, with a 37% drop, while the logic, analog and discrete markets have remained relatively flat.
Despite the challenging market conditions in 2023, a 9% to 12% recovery is expected in 2024, driven by strong demand for high-performance computing (HPC) and a soft inventory reduction in wireless communication and smartphones.
Here are some key trends for 2024:
- The server market is expected to see an upside trend, driven by artificial-intelligence business. A channel inventory reduction is ongoing.
- The telecom market is showing signs of a slowdown, with 5G rollout continuing only in parts of the world. Ericsson and Nokia are expected to continue to compete fiercely for market share against Huawei.
- Global consumer confidence remains low, despite a slight improvement in the middle of 2023. This could dampen demand for consumer electronics, but a weak recovery is expected.
- There are some initial signs of weakness in the industrial and automotive markets.
- Chip-on-Wafer-on-Substrate (CoWoS) is seeing a shortage, with a slight expansion in 2024. The high demand for advanced packaging boosted by AI applications will drive the market to find other solutions in the short term.
The Future of the AWE Industry Depends on New Variables
Since the end of World War 2, government policies have not been a variable in determining the future AWE market. Not too many years ago the major nations including China agreed on a policy to a policy which would result in stopping CO2 increases by 2050.
China has been a leader in applying air pollution control equipment to coal fired boilers. India is installing scrubbers and more efficient particulate control equipment. Hungary and Turkey have made significant pollution control investments.
The situation has radically changed in the last two years. Europe has put retired coal plants back into operation. Fighting has taken place at nuclear power plants in Ukraine. China has moved away from free enterprise. U.S. policy in the future depends on politics. The EU realizes the risks of depending on a consistent U.S. policy.
The U.S. is the world leader under almost any metric that is used. GDP has grown at a rate greater than other countries in the last few years. China is no longer seen as overtaking the U.S as growth rates have halved.
The U.S. produces more oil and gas than any other nation. It has the best military of any country. Its nuclear arsenal is equal to any other. It has been a strong partner in NATO. Its commitment has made European and some Asian countries confident enough that they have not built up their own nuclear arsenals or otherwise entered an arms race.
Given developments in Ukraine, North Korea, China, Hungary, Russia and the United States political stability is no longer assured. As a result, AWE companies have to factor in all the potential factors including an isolationist U.S.
Republicans appear to be supporting a 10% tariff on all imported goods and not just China. This America First policy could have a positive effect on domestic AWE service and fabricating companies. Specialized pump, valve, and compressor component manufacturers could see an increase in business. Many distributors offer to manufacture custom parts.
U.S. manufacturers of air and water filters will be in a better position in the domestic market. U.S. systems companies will benefit in the domestic market.
The downside for the U.S. AWE industry is the fact that 80% of the market is based on an international system which has castings manufactured in India and China at a fraction of the cost of a U.S. option. So one way or another costs for U.S. goods will rise.
The majority of the revenue in the AWE industry comes from international companies such as Emerson, GE, Dupont, 3M, Donaldson, and Ingersoll Rand. Barriers to free trade will be detrimental to these companies. But they have flexibility which domestic companies do not have. They can invest more in their offshore operations and then pursue geographies where they see the greatest potential.
The AWE industry will also be greatly impacted by the changes in global warming policy should isolationist regimes dominate in China, the U.S. Turkey, Hungary, and other countries.
Mcilvaine has been striving to predict political trends and their impact on the AWE market for 4 decades. It is complicated when you try to predict who will drink the koolaid at Jonesboro or be swayed by the $77,000 payment to families of dead Russian soldiers. The challenge is to predict life quality preferences for individuals rather than the assumptions in the conventional sustainability models. The patriarch setting up a trust fund for grandchildren has far different motivations than the father of a starving family in Gaza. This recognition of individual human motivation is the cornerstone of the Universal Sustainability Rating System (SURS).
Instant Market Insights

McIlvaine is conducting video conferences to answer urgent questions facing suppliers and investors. Bob McIlvaine acts as host and can bring over 50 years of experience in the air, water, energy and contamination control industries to bear. Since McIlvaine has very comprehensive services on Coronavirus Pharmaceutical and Technology Solutions he can offer unique insights on the impact of the virus on markets.
Discussions are enhanced with instant display of markets, market shares and technology analysis for dozens of products. The McIlvaine scope has been international since its first exhibition in London Olympia at Filtration and Separation 1975.
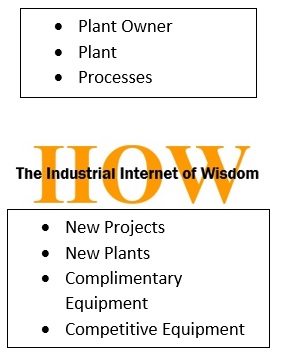
Holistic Content Marketing Program with IIOW
Increase Profits with Holistic Content Marketing
Mcilvaine is supporting suppliers who develop a Holistic Content Marketing Program utilizing the industrial internet of wisdom (IIoW).
What is holistic content marketing?
- Content Marketing helps the purchaser better understand all the factors which make the product the lowest total cost of ownership (LTCO)
- This entails a holistic approach using all the digital and printed tools available – an internet of wisdom.
- Detailed forecasts, the industrial internet of wisdom and total cost of ownership are basic factors in a cost effective Content Marketing Progarm Content Marketing Relies on Detailed and Accurate Forecasts
How can Mcilvaine help?
- Assist in the prioritization of application niches based on Total Available Market (TAM)
- Assist with competitor and other analyses to determine the Most Profitable Market (MPM)
- Help strengthen the applicable internet of wisdom
Assist in the prioritization of application niches based on Total Available Market (TAM)
Mcilvaine has multi client or custom reports in all areas of air and water flow and treat. Each report has anywhere from 50,000 to 500,000 forecasts of the Total Available Market.
These are bottoms up forecasts starting with analysis of processes and individual purchasers. Details on these reports are found at www.mcilvainecompany.com and then “Markets” at the top of the page.
Custom reports can be very detailed such as floating vs trunnion ball valves size 12-16 “in gas transmission pipelines by State in the U.S.
Assist with competitor and other analyses to determine the Most Profitable Market (MPM)
Content Marketing is focused on specific opportunities. The attractiveness of these opportunities is a function of supplier strengths compared to competitors. Mcilvaine can supply the competitive assessments as well as cost of ownership comparisons. These factors affect pricing and profitability and need to be included in the determination of the Most Profitable Market (MPM).
Help strengthen the applicable internet of wisdom
Holistic Content Marketing is effective only to the extent it uses the available knowledge in a manner to create wisdom. This Industrial Internet of Wisdom involves all the digital, verbal, and printed resources presented in the most useful way.
Mcilvaine has a number of flow and treat initiatives which can be leveraged by suppliers to maximize their success in using IIOW. There are two types of benefits
- Determining a credible cost of ownership for each product in each niche
- Convincing purchasers that the product has the lowest total cost of ownership (LTCO)
Mcilvaine decision guides, newsletters and databases can be leveraged by collaborating suppliers to maximize the IIOW value in increasing profitability.
|
Hydrogen Flow and Treat Market Niches Media Coverage of TCO Advantages Pharmaceutial Valve Profits Through LTCOV IFN HVAC TCO Factors Applications Gas Turbines & Reciprocating Engines |
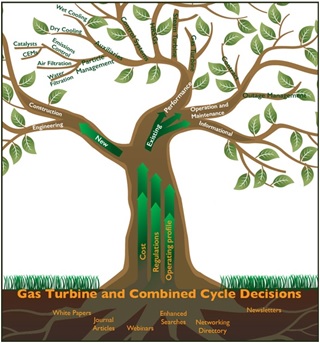
Decision Guides and Databases Global Decisions Orchard This website has a number of databases which can either be used directly or serve as a template for the supplier to use on his website. the application query shows an organized segmentation of industries and sub segments most applicable to flow and treat. The locations and products for thousands of companies can be accessed. There is an organized approach for segmenting processes and products. There are links to magazines and exhibitions. http://www.mcilvainecompany.com/Decision_Tree/subscriber/Tree/Default.htm The Gas Turbine and Combined Cycle Decision Guide also has child webs e.g . turbine intake filters and various air and water segments
http://www.mcilvainecompany.com/GTairTech/Subscriber/Default.htm Coal fired Power Plant Decisions has been published for 40 years and digitalized since 1999. There is free access to abstracts of magazine articles and links to full text. More than 200 hours of webinars can also be reviewed. Titles and excerpts from many thousand of articles can also be queried at no charge. The Utility E Alert is issued weekly. A free search of back issues with titles and excerpts is provided. Pharma Prospects is published twice per week. A free search of back issues with titles and excerpts is provided http://home.mcilvainecompany.com/index.php/databases/83ai-pharma-prospects Coronavirus Technology Solutions covers air filters, masks, and disinfection with alerts twice per week.. A free search of back issues with titles and excerpts is provided. http://home.mcilvainecompany.com/index.php/databases/82ai-coronavirus-market-intelligence Project Tracking and Databases Mcilvaine assessments are enhanced by the project tracking in many areas. Details are found at www.mcilvainecomany.com and then “Databases” at the top of the page. |
 Links to articles, recorded webinars and analysis are included for intake air, air pollution control, intake water, cooling, steam, and wastewater treatment.
83AI Pharma Prospects $1,600.00/year ($90.00/year each additional user) Click Here to Order
Weekly Alerts, 5 year forecasts for each country and an Intelligence System provide suppliers of air, water, and process equipment and consumables with a program to pursue pharmaceutical and biotechnology opportunities on a worldwide basis. The basic data is just the first step in an Industrial Internet of Wisdom approach which will result in collaboration and the ability to “pull” in customers rather than “push” them to an order.
Sample Profile Weekly Alert Sample Video Demonstration
Forecasts
Subscribers receive periodic excel spreadsheets with 5 year forecasts of pharmaceutical production revenues as well as flow and treat revenues in each country
The market for pharmaceutical air and water flow and treat products and services will grow to $55 billion in 2025
2020 was an unusual year with big growth in vaccines but slowdown in many pharmaceutical projects. However, the industry is returning to normal, and the market has been strong in the first half of 2021. The pandemic surge in India and other countries without vaccines is likely to result in continued expansion of vaccination production for the next several years.
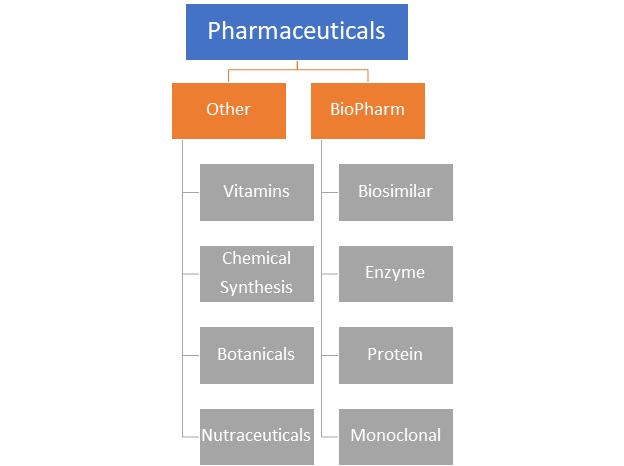
Certain segments of the market will grow more rapidly than others. Cell and gene therapy projects are a small portion of the total. But this segment is growing three times faster than the average.
The top ten purchasing countries in 2025 will account for 90% of the market.
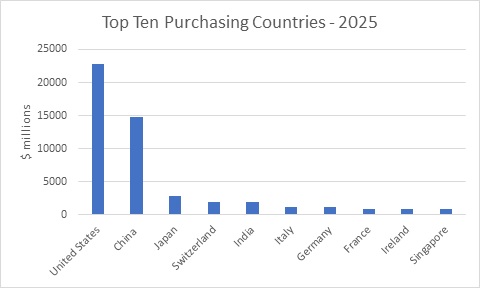
The air and water flow and treat expenditures will equal 3.9% of the pharmaceutical revenues in 2025.. the volumes of air and water being treated are modest compared to the chemical or mining industry. On the other hand, the potency and sensitivity of the products result in very high investments per unit of fluid moved or treated. This ratio is at its highest in cell and gene therapy. This potency and sensitivity have also resulted in single use systems which are converting one time into continual equipment investments.
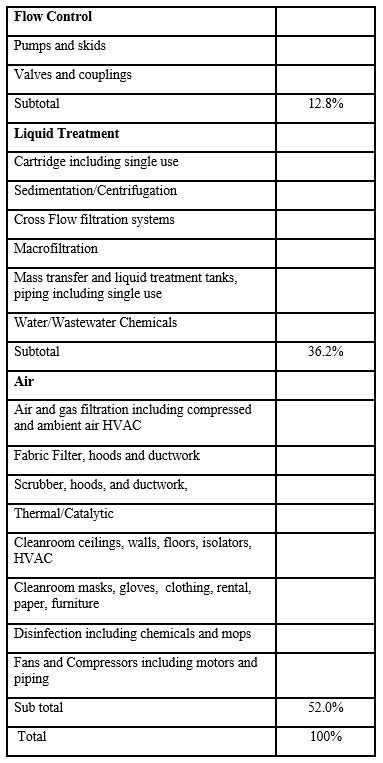
Here is a segmentation of the purchases by product. The categories include associated flow control instruments, software and hardware. Service and repair parts are also included.
Project Tracking Overview
Weekly Alerts and an Intelligence System provide suppliers of air, water, and process equipment and consumables with a program to pursue pharmaceutical and biotechnology opportunities on a worldwide basis. The basic data is just the first step in an Industrial Internet of Wisdom approach which will result in collaboration and the ability to “pull” in customers rather than “push” them to an order.
The ability to search Alerts back several years results in comprehensive knowledge about the following key aspects.
The service reports on water, air, and process activities and provides the opportunity for collaboration with suppliers of complementary equipment and services. It is part of an Industrial Internet of Wisdom.
The equipment and chemicals used in processing are often required to achieve higher performance than that used in air and water applications. Pumps and valves with both the ability to remain clean while moving slurries are needed. Due to the specific needs for cell and gene therapy single use products are now in demand.
Bob McIlvaine can answer your questions at 847 226 2391 or This email address is being protected from spambots. You need JavaScript enabled to view it.